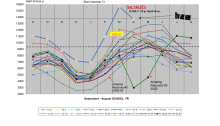
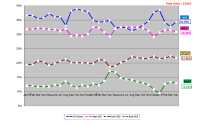
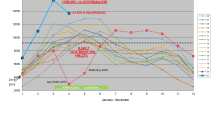
April 2021 — 4 Looks at PRICES

Dec 2019 through April 2021 — 15 of 17 CONSECUTIVE DOUBLE DIGIT y/y PRICE increases — Same Data — School Year view — 2 Year Price changes TrREB Bar chart —head and Shoulders above the rest Ronnie’s Simple line chart since 2007 – w spikes.

Is INFLATION a factor in house prices?

A residential property (less than 3 units) is three things: –from UNDERSTANDING REALTY FUNDAMENTALS – TIMING & YOUR OBJECTIVES *SHELTER – everybody must live somewhere. Ownership is superior to tenancy – Rent the space or Rent the money. *COMMUNITY – most people choose to live near others who share their goals and expectations. When you…

65+% of TRREB Activity is OUTSIDE 416

Distribution of Sales: 416 & her 3-905s This TrREB Chart breaks it down to 905 & 416 Averages … but just scratches the surface. Ave Prices ARE higher by only by 0.4% in April, but by +5% ytd in 905 (&April 2021 UP MORE yr/yr — +38% vs +24%) TrREB’s chart of the BIG Zones…

The 10 yr tells it — April SALES (best April Ever) still ‘way ahead of EVERYTHING – All-time 2nd Best # sales, All-time Second Best Ave Price

Inventory : as buyers gobble “everything excellent, very good & good” in this fast-paced, low-inventory environment – we remain 20-30% UNDER the 5-10 yr averages Surprisingly — NEW LISTINGS (yes take off 10-20% for Duplications due to Low-List & Hold Offer Date fails and New Listings instead of Price Change/ ReRuns) are 28-34% ABOVE the…