Recorded Thursday Afternoon Jan 5th 2023
Accompanying Charts


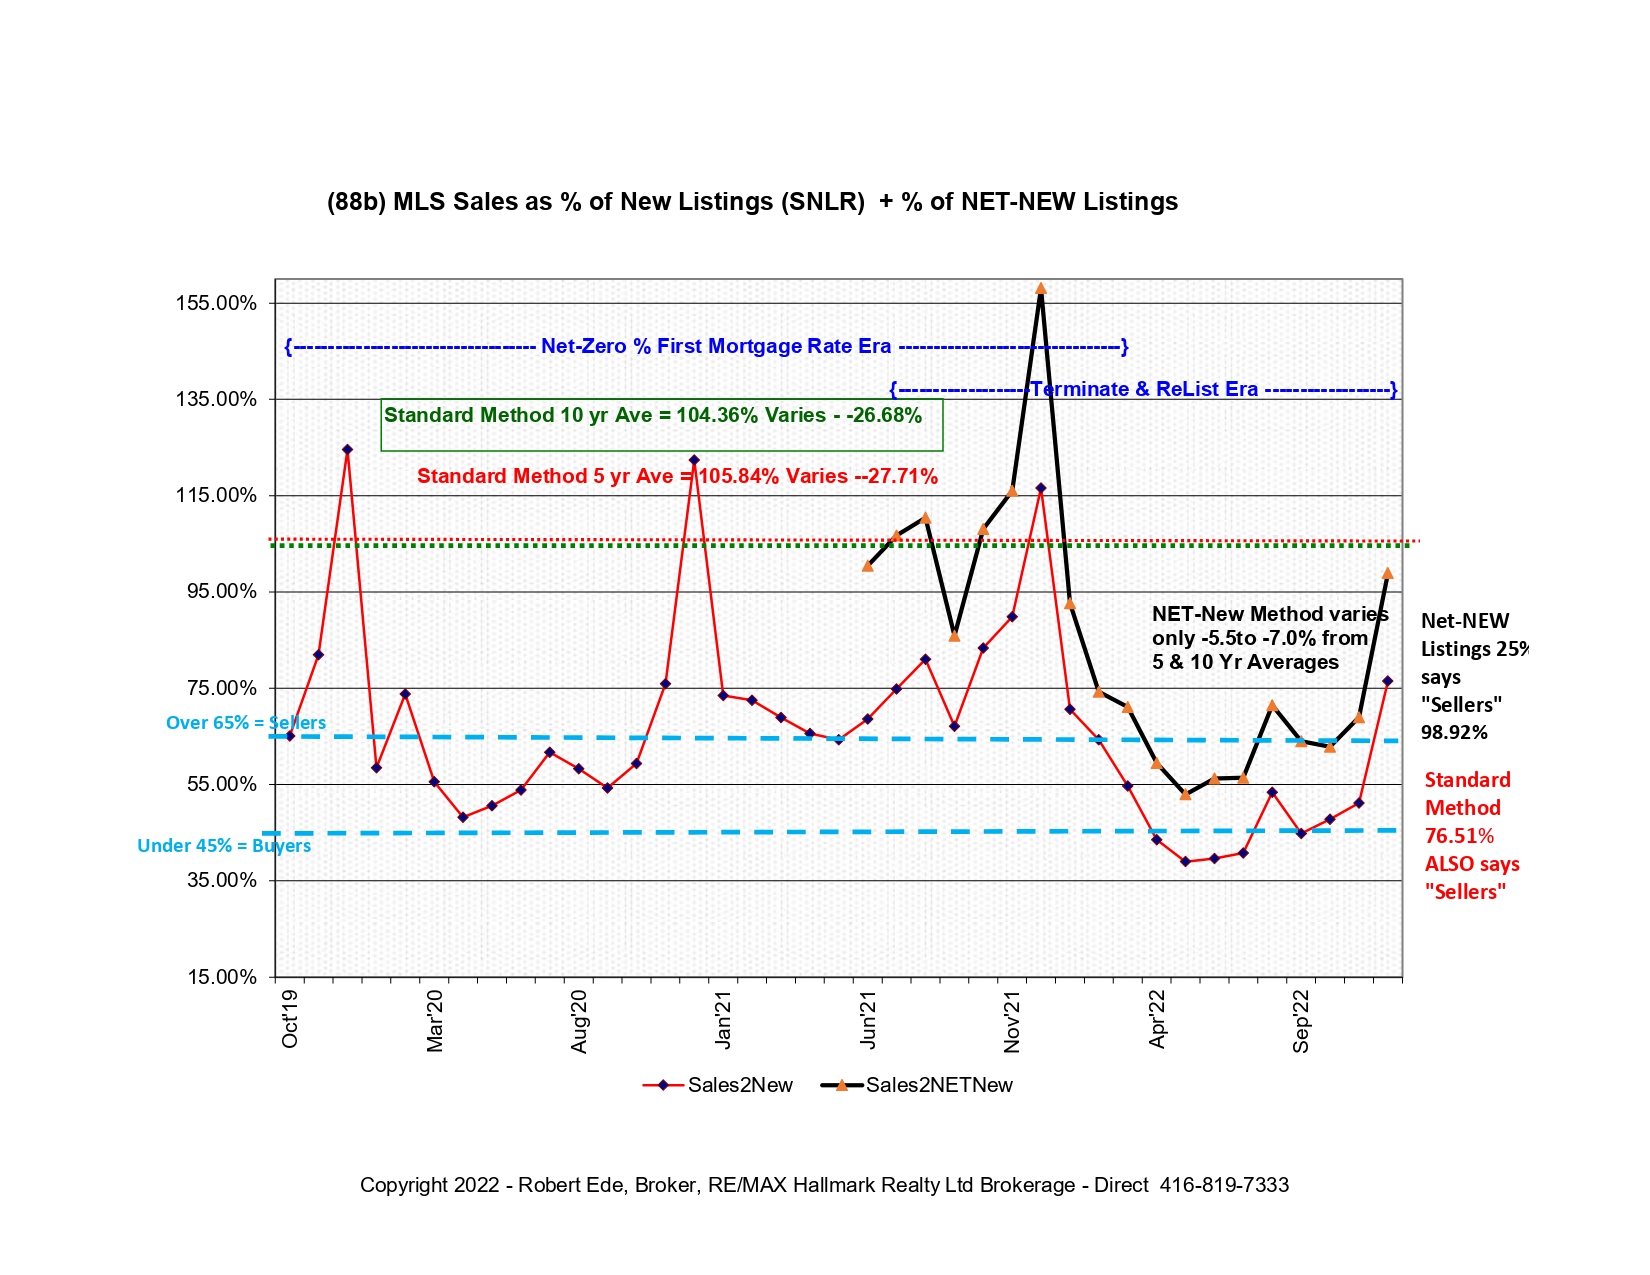
Corrected since recording — instead of “guessing at 25% ReList “Share of Total ” rate –
Actual TRREB December ReList Share was published as 923 listings representing 22.7% of 4,074 Total New Listings
Subtracting to obtain 3,151 Net-New Listing and to calculate that 29.29% of December listings were “Do-Overs” NOT NEW at all.

THEREFORE the resultant Sales to New Listing ‘Ratios’ are updated on this 88b Chart (below) to reflect the published results
As always (see next following TRREB Bar Chart) the SNL’Ratio’ is HIGH in December (Dotted horizontal 5yr Ave 105.84% and 10 yr at 104.36%)
Published New Listing @4,074 produces 76.51% -in any other month, an Extreme Seller’s Market
Net-New Listing @3,151 produces 98.92% … tightly aligned with the 5 &10 yr ave for December

Also Updated from Video recording time — which had only 2020 & 2021 as December columns

PART 2
EVERYTHING IS MONTHLY PAYMENTS


I’ll gladly run a ‘What Shall I do & Compared to What’ for your precise Selling/Buying situation
This example uses a $1,000,000 Selling Price


Excellent presentation Robert and Johnder
LikeLike